The favorable response to a post on visual thinking prompted me to share more about how visual thinking graphs fit into problem solving approaches within the strategic thinking and creative sessions we facilitate for clients.
X-Y Graphs - Simplicity in Visual Thinking
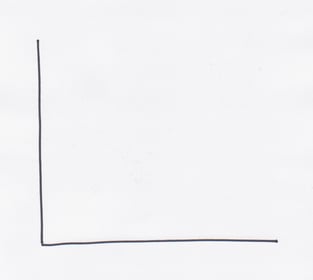
Perhaps the most resourceful of visual thinking graphs are the strategically humble, yet highly functional, X-Y graphs. With nothing more needed to begin than two perpendicular lines (or “axes”), getting started is within the drawing and creative skills of everyone. Even if the lines aren’t EXACTLY straight or at a perfect right angle, others will get the idea right away. (Heck, you can even click on the X-Y graph to your right, print it out, and use it!)
Starting with the X-Y graph’s simple shape, you can name the two lines, apply labels to describe what the names imply, and get going with a strategic thinking or creative exercise. What you put inside the X-Y graph can include shapes (lines, curves), labels (highlighting specific examples), or further subdivisions (additional perpendicular lines) to create a 4-box or other type of graph. That’s variety.
The Problem Solving Value of X-Y Graphs
Using X-Y graphs for problem solving lets you:
- Visually test your strategic thinking to see if it yields productive insights.
- Provide an opportunity for other people to react to your visualization of a strategic situation within the graph.
- Explain why certain developments are happening.
- Anticipate what developments may happen next.
- Have multiple people participate in the strategic thinking when placing where individual examples should be on the graph.
- Separate specific examples that could appear to be too close together.
- Group specific examples that could appear to be too far apart.
- Discover both positive and inverse relationships.
- Change the scales on the axes to see different relationships.
- Quickly explore potential relationships to see if the relationship is really meaningful.
- Be very precise or very approximate.
- Look for similarities and differences in various elements to suggest strategic steps to move from one group to another.
- Give tangibility to your early strategic thinking so you can come back and look at it later.
How can you argue with that much problem solving versatility from two simple lines and a few labels?
What ways are you using X-Y graphs?
Again, X-Y graphs aren’t unusual or complicated visual thinking graphs, but they will work hard for you. when it comes to problem solving. How do you use X-Y graphs as visual thinking tools in what you do? - Mike Brown
If you enjoyed this article, subscribe to the free Brainzooming blog email updates.
If you’re facing a challenging organizational situation and are struggling to maintain forward progress because of it, The Brainzooming Group can provide a strategic sounding-board for you. We will apply our strategic thinking and implementation tools on a one-on-one basis to help you create greater organizational success. Email us at info@brainzooming.com or call 816-509-5320 to learn how we can help you figure out how to work around your organizational challenges.


